AI & Attractors
Gödel, Escher, Bach: An Eternal Golden Braid, 1979
The 1979 book by Douglas Hofstadter with the tagline: “a metaphorical fugue on minds and machines in the spirit of Lewis Carroll”, inspired my early years in computing. I think one reviewer described it as a workout in the best mental gym in town. I think it was a guy who I used to go to Nottingham Jazz club with who was also a professional programmer recommended it to me in around 1984. I read it like a bible, savouring each chapter like a fine wine. It was entertaining and endlessly fascinating. I became hooked on the idea of machine intelligence and the ability of computation to represent so much more than arithmetic. I remember that my wife at that time was working as producer on a late evening radio show for BBC Nottingham and went off to work on a Sunday evening reminding me to listen in. I devoured chapters of GEB with one ear tuned to the radio and the other listening out for our sleeping daughter who never disturbed me from my weekly workout.
Benoit Mandelbrot’s famous fractal
A.K. Dewdney published an article in the August 1985 issue of Scientific American under the title “Computer Recreations: A computer microscope zooms in for a look at the most complex object in mathematics.” The article helped make famous the Mandelbrot set, named after mathematician Benoit Mandelbrot.
I was an avid Scientific American reader at the time and became a “computer microscopist” almost immediately. When the first article on the Mandelbrot set came out I was a junior programmer in Nottingham (for a DEC OEM and systems house). I had also resumed my academic studies in Mathematics with an Open University foundation course and so the scene was set for a lifelong fascination with emergent behaviour. The idea that such an object could be generated from a simple iterated function was, and still is, deep and mysterious. As much as any picture that we have seen of distant galaxies through the wonderful images of the Hubble space telescope or the beautiful structures revealed by microscopy here was fundamental reality jumping out of the complex plane onto the computer monitor. It was breathtaking.
I even spent some of my wages on a new Sinclair “Quantum” computer so I could compute the set in color on an old portable TV that I had commandeered for the home lab and spent what seemed like a small fortune on a c compiler for it so it could compute the set in low resolution in mere hours. Coming home from work I would rush up to the small room I used as a study and excitedly switch on the monitor to reveal the days output.
I remember programming the iterations of the \(z \leftarrow z^2 + c\) relation in assembler in Macro 11 (DEC PDP-11 assembler) and rendering the output on one of the line printers at work. Core time/cycles and paper were so expensive then it felt like (and probably was) a misuse of company resources and I would guiltily grab my output from the stack and separate the jobs before anyone could notice. I became a decent systems programmer in my furtive forays rendering the intricacies of attractors sometimes staying late at work to take advantage of quiet time on our largest computer a half a room sized PDP 11-70.
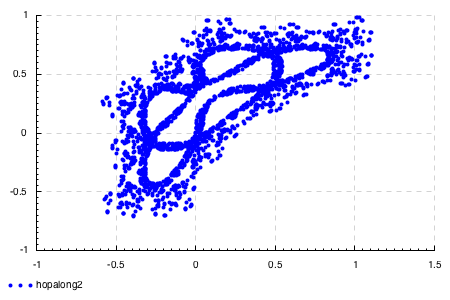
Barry Martin’s - “hopalong” fractal
Hopalong orbits were discovered by Barry Martin from Aston University, Birmingham, England.
A.K. Dewdney presented the Hopalongs in the magazine “Scientific American” in the September 1986 edition in his Computer Recreations column under the title “Wallpaper for the mind: computer images that are almost, but not not quite, repetitive”.
At the time the Martin attractor article was published I was a support specialist in the “Micro’s” group at DEC’s UK support centre in Basingstoke. I had at my disposal a VaxStation running Ultrix32/BSD 4.2/X11. Luckily I had applied for a job there supporting RT11/RSTS and my systems programming and out of hours playing with an abandoned Z8000 based Unix box in our computer room in Nottingham had paid dividends and I had finally had got my hands on a proper “microscope”. Incredibly I was being paid to play with it as well as handle up to 500 technical support calls a month learning as much as I could.
Digital Equipment’s support centre had a campus feel and was staffed by bright young people with as much enthusiasm as I had for programming these systems. It was geek heaven and I stayed with them both in UK and later in their European support centre for about six glorious years supporting Unix workstations from the compilers and operating system internals down to the range of Vax32 and later Mips32 architectures they ran on.
But back in Basingstoke in ’86 a chance comment by a passing colleague was about to set the seeds of a big idea.
Hopalong orbits
I can’t remember which of the relations I had plotted I think it was a variation on hopalong below. I know it had a sin function so that might be the one. I remember it took quite a while to fill the image in as it incrementally computed the next point and plotted it. Often most of the points would be out of the field of view until part of the orbit would fall into field. I did not re-scale the output, just aimed the viewport at a particular region of the \(\mathbb{R}^2\) plane and waited for the image to emerge, this made it somewhat more like a discovery and was quite exciting even if wasteful of cycles (in a couple of years I had cycles to spare, though it’s worth pointing out that the workstation I was privileged to call “mine” was probably worth a whole years salary!)
Anyway after one such run a particularly colorful and fine structured object had revealed itself on my screen and my passing colleague stopped and exclaimed, “Oh where did you get the micrograph of that?” (and here I can’t remember the exact word she used) but she was clearly referring to some biological entity I had never heard of not even having taken an GCE O level in biology. “No I made it, it’s a mathematical object. A simple iterated formula!”. She was not convinced and I had to show her the code and run it again before she earnestly said, “Wow well that’s odd, I’ve seen one of those under a microscope…”, she had a degree in biology and had learned her computing skills running lab systems under RSX11. We were both a bit bemused.
I guess it’s common place nowadays for people to take such things as a given. But really? I mean that got me thinking… biological structures could be evolved from simple function systems?
Of course proper mathematical biologists were very few in number in those days. We should have dropped everything and collaborated but we both had mortgages to pay and life in DEC was a lot of fun. It took another twenty years before I had the luxury of doing any curiosity based research and my mathematical and biological sophistication had grown enough to get me thinking seriously about this again.
I’ve quickly reproduced the relations and a quick plot based visualization below and in a future post I’ll provide some code to visualize these in the raw using openCL.
Meanwhile I’ve included links to the original Scientific American articles.
hopalong :: Int -> Double -> Double -> Double -> [(Double, Double)]
hopalong 0 _ _ _ = []
hopalong i x y a = (x, y) : hopalong (i-1) (y - sin x) (a - x) a
hopalong2 :: Int -> Double -> Double -> Double -> Double -> Double -> [(Double, Double)]
hopalong2 0 _ _ _ _ _ = []
hopalong2 i x y a b c =
(x, y) : hopalong2 (i-1) (y - (signum x * sqrt (abs (b * x - c)))) (a - x) a b cimport Graphics.Rendering.Chart.Easy
import Graphics.Rendering.Chart.Backend.Cairo-- as we compute all the points first the chart rescales so we miss the fine
-- detail I'll fix this by doing something in openCL in a future post
toRenderable $ plot (points "a=0.07 Pi" (hopalong 500 0 0 (0.07*pi)))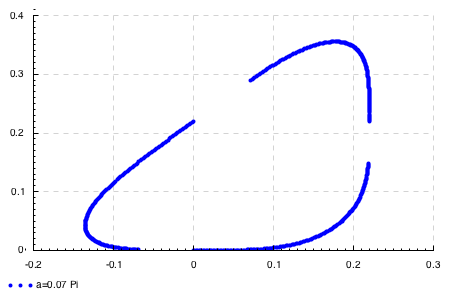
toRenderable $ plot (points "hopalong2" (hopalong2 2500 0 0 0.4 1 0))